Food Waste
Food Wastes arise from households, hospitality and food services, manufacturing, retail and wholesale and agricultural sectors.The DEFRA[1] data reports 'Animal & Food Waste' at 3.8 million tonnes, with around 20% being Food Waste from Households (with around 490 thousand tonnes speparately collected in England alone in 2020).
Local Authority data[2] for England suggests separately collected food waste was 500 thousand tonnes in 2022/23 and this represented 5.2% of recycling perfromance (this excludes food waste collected with Green Wastes). DEFRA data does not capture food in residual waste or waste processed in agriculture that does not require reporting.
WRAP estimate in their most recent data[3] that around 10.2 million tonnes of Food Waste are generated for aroud 39 million tonnes purchased in the UK (around 25% is therefore wasted).
Animal & Food Waste Arisings by Economic Classification (UK 2020)
Animal & Food Waste Arisings
- 3,757.33 thousand tonnes (UK 2020 per above)
- 2,818.67 thousand tonnes (England 2020)
- 75.0% of tonnage was from England
Data source: [1]
Animal & Food Waste Arisings (Waste Category and Economic Classification)
Commercial and Industrial* | UK 2020 | England 2020 | England 2022 |
|---|---|---|---|
Manufacturing | 1,628.34 | 1,171.27 | 1,035.66 |
Water Treatment | 1.12 | 0 | 0 |
Services | 1,358.49 | 1,147.68 | 907.54 |
Total | 2,987.95 | 2,318.95 | 1,943.20 |
% Total and % England | 79.5% | 82.3% |
Municipal Solid Waste* | UK 2020 | England 2020 | England 2022 |
|---|---|---|---|
Services | 1,358.49 | 1,147.68 | 907.54 |
Household | 746.55 | 491.37 | 503.14 |
Total | 2,105.04 | 1,639.05 | 1,410.68 |
% Total and % England | 56.0% | 58.1% |
All figures in thousand tonnes. Data source: [1] * See data limitations.
WRAP Estimates of Food Waste in the UK
Notes
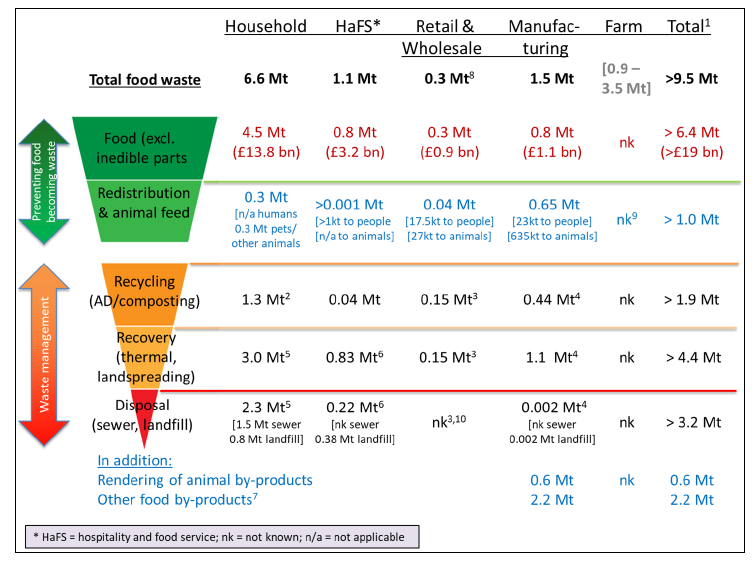
The graphic on the left was produced by WRAP in 2019, with the key facts updated in a recent report[2] for totla food wastes:
- Household waste at 6.0 vs 6.6 million tonnes
- HaFS unchanged
- Retail & Wholesale waste at 0.2 vs 0.3 million tonnes
- Manufacturing waste at 1.4 vs 1.5 million tonnes
- Farm/Agriculture 1.6 vs range of 0.9 to 3.5 million tonnes
- Total food waste at 10.2 vs 9.5 million tonnes (which excluded Farm)
Excluding inedible parts the figure has changed from 6.4 to 6.1 million tonnes.
Targets
- Whiilst there are no targets in England, the UK Food and Drink Pact (UKFDP, formerly the Courtauld Commitment 2030) is to reduce food waste by 50% (post farm gate) per person by 2030 against a 2007 base
- Scotland has a target of a 33% reduction by 2025 from a 2013 base[4]
- Wales has a target of 50% reduction by 2025 on a 2006/7 base and a limit of 5% to landfill[5]
Simpler Recycling Definition
- All food intended for human or household pet consumption, regardless of whether it has any nutritional value
- Biodegradable material resulting from the processing or preparation of food, including inedible food parts such as bones, eggshells, fruit and vegetable skins, tea bags and coffee grounds.
Collection
Food Waste is collected as part of a Local Authority Collection Service and with the introduction of Simpler Recycling in England, and similar in other countires, is required to be collected separately from households and businesses.
Comingled collection with Green Waste in some Local Authorities is likley to diminish as Simpler Recycling is implimented (although Local Authorities can make a case to continue under TEEP).
Treatment
Separately collected food waste from households is primarily treated via Anaerobic Digsetion facilties.
Some other food waste streams and animal waste streams are also treated via AD, with some in dedicated AD facilties - for example focused on a diary wastes.
Some treatment technologes are more specific to the waste to be treated, and can include incineration and rendering.
Links to
References:
- UK Statistics on Waste
- Local Authority Collected Waste for England (DEFRA: March 2025 for annual period 2023/24)
- UK Food Waste & Food Surplus - Key Facts (WRAP July 2025 estimated based on 2021 and 2022 data )
- Managing Food Waste (Scottish Government )
- Beyond Recycling (Welsh Government 2021 publication)